RustyRender: Bresenham’s line-drawing algorithm (lesson 1)
June 12, 2022 — 14 minute read — rust, graphics
Now that we have a working TGA library for drawing our renders, it’s time to get started actually writing our 3D renderer. For that, we need to start by drawing lines. Seems pretty simple, right? The tinyrenderer lesson works through several approaches before settling on an optimized implementation of Bresenham’s line-drawing algorithm. For this post, we’ll write all the same algorithms in Rust, and I’ll do my best to explain what is going on with each and why it needs to be improved.
Arbitrary steps
Our first approach might look something like this:
fn line<T: ColorSpace + Copy>(
    x0: isize,
    y0: isize,
    x1: isize,
    y1: isize,
    image: &mut Image<T>,
    color: T,
) {
    let mut t = 0.0;
    while t < 1.0 {
        let x = x0 + ((x1 - x0) as f64 * t) as isize;
        let y = y0 + ((y1 - y0) as f64 * t) as isize;
        image.set(x as usize, y as usize, color).unwrap();
        t += 0.01;
    }
}
The idea here is pretty simple. Split the line into 100 pieces, where our t value represents the portion of our total line that we’ve covered. We can get the x and y coordinates of the current piece by adding the total length of the line in each direction, multiplied by t, to the starting point for the appropriate coordinate. For example, to draw the 45th step of a line, x can be found by multiplying x1 - x0 (the total x-length of the line) by 0.44 (the step value, i.e. 45% of the way through the line) and adding it to the starting point for x, which is x0.
While this is a pretty simple algorithm, it’s also inefficient (e.g. it would draw 100 times for a 5-pixel line) and it doesn’t work for lines longer than 100 pixels: some pixels on the line will be missed, leaving a spotty line. The original tinyrenderer lesson demonstrates this by using only 10 steps (i.e. upping the step to 0.1), but we can also see it by just drawing a longer line:
const RED: RGB = RGB { r: 255, g: 0, b: 0 };
const WHITE: RGB = RGB { r: 255, g: 255, b: 255 };

fn main() {
    let mut image: Image<RGB> = Image::new(200, 200);
    line(20, 20, 180, 180, &mut image, WHITE);
    image.write_to_file("output.tga", true, true).unwrap();
}
A dynamic number of steps
It’s not hard to determine the right number of steps to take; we can just draw once for each x coordinate in the line and we can figure out our t value by checking how far along the X coordinates of the line we are:
fn line<T: ColorSpace + Copy>(...) {
    for x in x0..=x1 {
        let t = (x - x0) as f64 / (x1 - x0) as f64;
        let y = y0 as f64 * (1.0 - t) + y1 as f64 * t;
        image.set(x as usize, y.round() as usize, color).unwrap();
    }
}
This fixes our spotty line:
But will draw holes of its own if an angle is steeper than 45° (we’re only drawing once per X coordinate, after all) and doesn’t draw at all if x0 is greater than or equal to x1 (there should be a red line covering the white one):
line(13, 20, 80, 40, &mut image, WHITE);
line(20, 13, 40, 80, &mut image, RED);
line(80, 40, 13, 20, &mut image, RED);

Third attempt
So how do we avoid holes? Dmitry writes that his students suggest checking whether the height is greater than the width and iterating over y or x as appropriate. This fixes the holes but we still don’t get that second red line covering the white one. For that, we swap the points if x0 is smaller than x1. Here’s my annotated adaptation of Dmitry’s code:
// Use mutable coordinates so we can swap them around
fn line<T: ColorSpace + Copy>(
    mut x0: isize,
    mut y0: isize,
    mut x1: isize,
    mut y1: isize,
    image: &mut Image<T>,
    color: T,
) {
    // Is it steeper than 45°? If so, we transpose the line
    // (https://en.wikipedia.org/wiki/Transpose). This
    // essentially guarantees we are drawing a line less
    // steep than 45°.
    let steep = (x0 - x1).abs() < (y0 - y1).abs();
    if steep {
        swap(&mut x0, &mut y0);
        swap(&mut x1, &mut y1);
    }
    // If our line is running right-to-left, flip the points
    // so we start on the left.
    if x0 > x1 {
        swap(&mut x0, &mut x1);
        swap(&mut y0, &mut y1);
    }
    // For each X coordinate (which is actually a Y coordinate
    // if the line is steep), we calculate the Y coordinate the
    // same way as before.
    for x in x0..=x1 {
        let t = (x - x0) as f64 / (x1 - x0) as f64;
        // If you're confused about this line, it's equivalent to
        // y0 + (y1 - y0) * t
        let y = (y0 as f64 * (1.0 - t) + y1 as f64 * t).round();
        if steep {
            // Remember the transpose? This is where we undo it,
            // by swapping our y and x coordinates again
            image.set(y as usize, x as usize, color).unwrap();
        } else {
            image.set(x as usize, y as usize, color).unwrap();
        }
    }
}
This is a functional line-drawing algorithm. It correctly draws lines at any angle (including completely vertical or horizontal) and works regardless of the order the points are specified. Actually, to get it to draw a horizontal line correctly I had to modify Dmitry’s algorithm to round the Y coordinate, without which the line wavers between two pixels.
Optimization (and premature optimization)
This algorithm works for pretty much any case within the image boundaries. My implementation of image.set() will return an Err if a pixel is out of boundaries, so there would be an error there. Dmitry mentions this and recommends adding error checking but doesn’t include it in the lesson to keep the code clean. I’m doing that for the same reason, and in a future post I will likely rework the types and error checking somewhat to make things a little simpler. For example, having so many as usize or as f64 statements is both noisy and may be prone to errors, and that will become even more obvious in the following post as we start drawing triangles.
Another issue with this algorithm, though, is its inefficiency. It uses two float multiplications and a float division in every loop iteration, which are a lot slower than integer operations, and is especially noticeable when drawing a large number of lines. Both the multiplication/division and the use of floating-point numbers can be avoided by using a specific version of Bresenham’s algorithm. The tinyrenderer lesson is a little bit sparse in its explanation of the algorithm, but the Wikipedia page has great explanations, visuals, and pseudocode.
Blind optimization
Dmitry’s tutorial demonstrates the need and benefit of optimizing our line-drawing algorithm by drawing three lines 1,000,000 times each and looking at the performance profile for each function that is called using the gprof tool. This is done by using several debugging options when compiling the C++ code. When the program is run, it samples the code at a high frequency and records what function is being called at each point. This can give a good idea of where the code is spending most of its time and help to know where improvements are best made. Here’s the output given in the tutorial:
%   cumulative   self              self     total
 time   seconds   seconds    calls  ms/call  ms/call  name
 69.16      2.95     2.95  3000000     0.00     0.00  line(int, int, int, int, TGAImage&, TGAColor)
 19.46      3.78     0.83 204000000     0.00     0.00  TGAImage::set(int, int, TGAColor)
  8.91      4.16     0.38 207000000     0.00     0.00  TGAColor::TGAColor(TGAColor const&)
  1.64      4.23     0.07        2    35.04    35.04  TGAColor::TGAColor(unsigned char, unsigned char, unsigned char, unsigned char)
  0.94      4.27     0.04                             TGAImage::get(int, int)
The first column shows us that around 69% of the time is spent in the line function, which means improving its speed would improve the overall speed of the program significantly. It’s also looking that this line that I made my first big mistake in my own optimization efforts. See that 2.96 seconds part? After all the optimizations are done, that number goes down to 0.64:
%   cumulative   self              self     total
...
 30.08      1.55     0.64  3000000     0.00     0.00  line(int, int, int, int, TGAImage&, TGAColor)
...
After I copied all of the optimization steps as closely as possible, I ended up with a total execution time of a lot more than 0.64 seconds:
$ cargo build
...
$ time target/debug/rustyrender
real    0m9.957s
user    0m9.943s
sys     0m0.010s
And if you’re a little more careful than I am, you might be wondering now what on earth is he talking about, comparing his program’s total execution time to the line function’s execution time in the original implementation? Unfortunately, I misinterpreted the 2.95 and 0.64 seconds to mean total program execution time and then went on to try to optimize my program further without checking the tinyrenderer execution time on my own computer. Gah! Not my smartest moment.
On the bright side, my stupidity let me learn a little bit about how to profile rust using perf and showed me how some of Rust’s abstractions aren’t quite as cheap or free as I had assumed. For example, perf was telling me that nearly 10% of my execution time was taken up in the <core::ops::range::RangeInclusive<T> as core::iter::range::RangeInclusiveIteratorImpl>::spec_next function. A little bit of digging and I figured out that came from the for x in x0..=x1 {} loop, which uses an iterator. Switching to a while x <= x1 {} loop and manually incrementing my x value completely removed all of those calls and dropped my execution time by an unexpected ~40%:
$ time target/debug/rustyrender
real    0m6.288s
user    0m6.285s
sys     0m0.006s
After a couple hours of frustrating but educational optimization and a break until the next day, I had made very slight but insignificant speed improvements and finally realized I should run the C++ code and try to figure out how it could possibly be running 6.288/0.64=9.825 times faster, only to see this:
$ g++ -ggdb -g -pg -O0 main.cpp tgaimage.cpp model.cpp -o main
$ time ./main
real    0m5.160s
user    0m5.151s
sys     0m0.012s
Oh.
That’s still faster, but it’s not that much faster. And looking at gprof output for the C++ version versus perf output for my Rust version… the % of time spent in each function was very similar to its analog. I decided not to investigate too much, but it seems that Rust is a bit slower because setting values in the TGA data Vec uses some bounds checking and such, where the C++ version just uses the super fast memcpy function.
I’ll take what I can get and move on, happy with what we’ve got.
Bresenham’s algorithm
So what changes do we actually make to implement Bresenham’s line-drawing algorithm? It’s a bigger difference than I expected. Here’s my final code:
fn line<T: ColorSpace + Copy>(
    mut x0: isize,
    mut y0: isize,
    mut x1: isize,
    mut y1: isize,
    image: &mut Image<T>,
    color: T,
) {
    let steep = (x0 - x1).abs() < (y0 - y1).abs();
    if steep {
        swap(&mut x0, &mut y0);
        swap(&mut x1, &mut y1);
    }
    if x0 > x1 {
        swap(&mut x0, &mut x1);
        swap(&mut y0, &mut y1);
    }

    let dx = x1 - x0;
    let dy = y1 - y0;
    let derror2 = dy.abs() * 2;
    let mut error2 = 0;
    let mut y = y0;

    let mut x = x0;
    while x <= x1 {
        if steep {
            image.set(y as usize, x as usize, color);
        } else {
            image.set(x as usize, y as usize, color);
        }

        error2 += derror2;

        if error2 > dx {
            y += if y1 > y0 { 1 } else { -1 };
            error2 -= dx * 2;
        }
        x += 1;
    }
}
First thing to notice: The beginning is the same. We’re still checking to see how steep our line is and transposing it if necessary, and we’re still making sure our points are going left to right. After that, things get more confusing.
The basic gist of this algorithm is that we keep track of our X and Y coordinates and iterate through our X coordinates, checking how far our Y coordinate is from the true line on each step. If our Y value is greater than half a pixel away from the true line, we increase it or decrease it as needed to get it closer. The code obfuscates this a little bit by using some algebra to avoid floating point numbers and division. Here’s what changed from the less-optimized version:
     let dx = x1 - x0;
     let dy = y1 - y0;
-    let derror2 = dy.abs() * 2;
-    let mut error2 = 0;
+    let derror = dy.abs() as f64 / dx as f64;
+    let mut error = 0.0;
     let mut y = y0;

     let mut x = x0;
@@ -31,11 +30,11 @@
             image.set(x as usize, y as usize, color);
         }

-        error2 += derror2;
+        error += derror;

-        if error2 > dx {
+        if error > 0.5 {
             y += if y1 > y0 { 1 } else { -1 };
-            error2 -= dx * 2;
+            error -= 1.0;
         }
         x += 1;
     }
The derror value is essentially the slope of the line, so every iteration of our X coordinate increase our total error by that slope value until our error is greater than 0.5, which means we increase or decrease our Y value by 1 and decrement our error by 1 to compensate; rinse and repeat. The no-float/no-division optimization simply moves the dx divisor out from the derror definition and multiplies these error values by 2 so we don’t have a floating-point dx * 0.5 in there.
Wireframe
With that, we can draw our wireframe!
Except we don’t have a library to read the .obj files… That’s not too difficult, though. These .obj files are text files that define vertices by their 3 dimensions and triangles by a list of the three vertices that make them up (referenced by index as defined in the file). That means we can read these files by making some simple geometry structs and doing some basic text processing.
First, our 3-dimensional vector type:
use num::Float;

#[derive(Debug)]
pub struct Vec3<T: Float> {
    pub x: T,
    pub y: T,
    pub z: T,
}

impl<T: Float> Vec3<T> {
    pub fn new() -> Self {
        Vec3 {
            x: T::zero(),
            y: T::zero(),
            z: T::zero(),
        }
    }

    pub fn from(x: T, y: T, z: T) -> Self {
        Vec3 { x, y, z }
    }

    pub fn from_slice(slice: &[T]) -> Self {
        Vec3 {
            x: slice[0],
            y: slice[1],
            z: slice[2],
        }
    }
}
Don’t worry about the num::Float thing right now. The idea was that this generic type would only take floating point numbers, but I’ll be messing with those types in a future post. This isn’t a terribly complicated struct: it holds X, Y, and Z coordinates, and can be created with all zeros, from function arguments, or from a slice—which comes in handy in our .obj reader:
// Takes a line of the format `v 0.1 0.2 0.3` and returns a Result<Vec3> from the numbers
fn get_vertices(line: String) -> Result<Vec3<f32>, String> {
    let result_array: Result<Vec<_>, _> = line
        .split_ascii_whitespace()
        .take(3)
        .map(|x| x.parse::<f32>())
        .collect();
    match result_array {
        Ok(arr) => Ok(Vec3::from_slice(arr.as_slice())),
        Err(_) => Err(String::from("Couldn't parse 3 numbers form line")),
    }
}

// Takes a line of the format `f x/x/x y/y/y z/z/z` and returns a Vec<usize> containing the first
// number in each set - 1 (which is each vertex index for that face, adjusting for the 1-based
// indexing of the wavefront .obj format)
fn get_face_indicies(line: String) -> Result<Vec<usize>, String> {
    line.split_ascii_whitespace()
        .take(3)
        .map(|x| {
            if let Some(x) = x.split("/").next() {
                match x.parse::<usize>() {
                    Ok(x) => Ok(x - 1),
                    Err(_) => Err(String::from("Failed to parse face vertex number")),
                }
            } else {
                Err(String::from("Missing face vertex number"))
            }
        })
        .collect()
}
With these functions, building the final model is pretty straightforward. Rather than show all that code, feel free to just take a look at it. The most important part was just that Vec3 type, and the functions we’ll use to actually read a file and generate the wireframe are pretty self-explanatory. Here’s a final product rendering the african_head.obj file:
fn main() {
    let width = 800;
    let height = 800;
    let mut image: Image<RGB> = Image::new(width, height);

    let model = Model::from("obj/african_head.obj").unwrap();

    for i in 0..model.num_faces() {
        let face = model.face(i);
        for j in 0..3 {
            let v0 = model.vertex(face[j]);
            let v1 = model.vertex(face[(j + 1) % 3]);
            let x0 = ((v0.x + 1.) * (width as f32) / 2.) as isize;
            let y0 = ((v0.y + 1.) * (height as f32) / 2.) as isize;
            let x1 = ((v1.x + 1.) * (width as f32) / 2.) as isize;
            let y1 = ((v1.y + 1.) * (height as f32) / 2.) as isize;
            line(x0, y0, x1, y1, &mut image, WHITE)
        }
    }

    image.write_to_file("output.tga", true, true).unwrap();
}
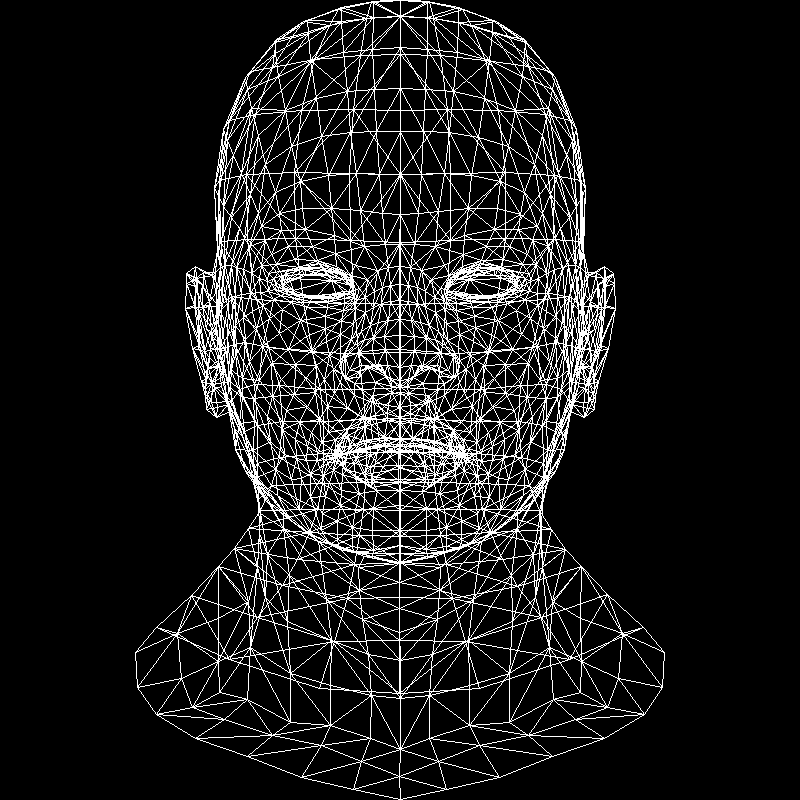
And with that, I can render a complete wireframe from scratch, using handwritten Rust all the way down!
This post only covers line drawing and wireframe rendering. For the rest of my tinyrenderer journey, please read my other posts:
- Lesson 0: Porting the TGA library
- Lesson 2: To be posted
This list will be updated as posts are added.
Feel free to use the complete source code for this lesson.